Library of Forex strategies with detailed descriptions, developed by professional traders
Forex trading strategies compose a free library of trading systems created by experienced traders. New profitable Forex trade strategies are constantly added to our library, we carefully select the materials and collect only the best and working currency trading strategies around the world.
In order to find the most suitable currency trading strategy for you, you need to take into account all aspects of your trade: preferred tools, market behavior model, psychological factor, etc. A systematic approach will help you choose the exact trade strategy in Forex that will work for you and increase the efficiency of Forex trading.
That is why Litefxinvestments gathered all sorts of actual working trading strategies in one place. Our library presents both intraday Forex strategies and medium-term trading systems. We selected the best Forex graphic patterns, currency trading strategies, stock exchange and scalping Forex strategies. Select the very trading strategy that meets your preferences completely and will help make your work on the Forex market as efficient as possible.
Head and shoulders

It is believed that if you look into the abyss for a long time, the abyss begins to look at you. The same happens to a trader when he/she explores a chart for too long, as he/she may begin to see the patterns, which the chart does not contain at all. In this case a trader misrepresents a real picture presented on the chart and makes unsuccessful transactions.
It may seem that identifying the pattern on the chart is the easiest task. They all are described in books and articles; however sometimes we see only what we want to see. One of the patterns, which has confused a lot of traders is the pattern «head and shoulders» and we will talk about in this article.
Head and shoulders is a reversal pattern, which helps to predict further price behavior. Unfortunately, this pattern is formed on the chart not as often as traders expect.
The basic principle of building up this pattern is the formation of three tops, the middle one of which (head) is higher than two others. This pattern shows that both the bulls and the bears had repeatedly tried to take a lead; finally both of them lost strength and as a result the trend has reversed changing direction.
The right shoulder of the pattern represents the last attempt to take over, which was unsuccessful.
The problem is that many traders see this pattern on the chart when it is not there, as it is possible to plot this pattern almost on any part of the chart. It happens that experienced traders can filter out false images, while the beginners take them as real patterns.
In the pattern «head and shoulders», the left shoulder is always slightly below the right one and the head is higher than both of them. You can see this pattern on any timeframe, but a trader shall remember that there are more chances of false image on the lower timeframes.
Entry point
The formation of the pattern «head and shoulders» on the chart is a signal to open a trade. There can be both direct patterns and reverse ones; the patterns giving signals to buy or sell.
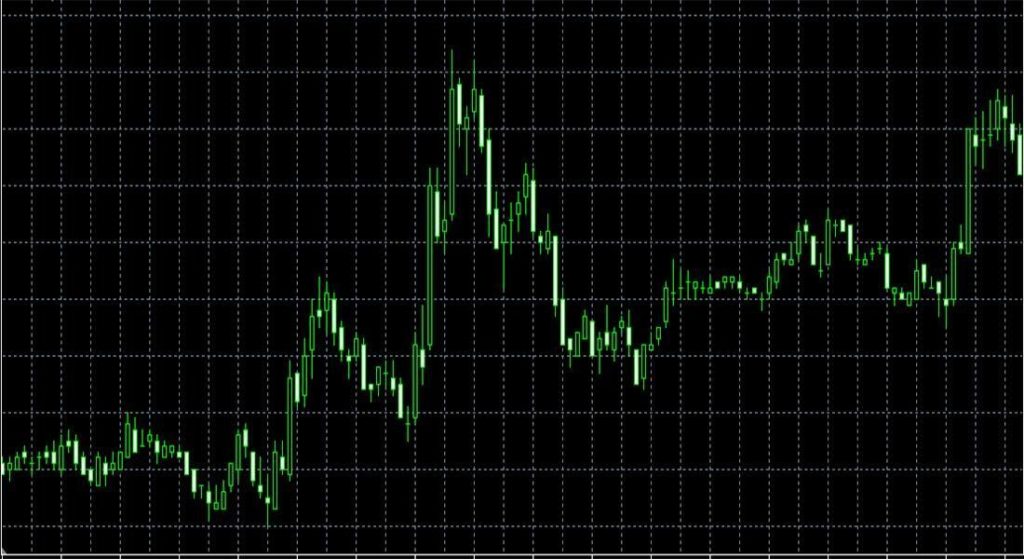
The chart above shows a pattern giving a sell signal. In order to determine an entry point a trader shall draw a line from the bottom of the left shoulder to the bottom of the right one. Breakdown of this line is a signal to open a trade.
Our example shows an aggressive signal, as we do not know whether the formation of the pattern has completed or not, as the formation of the right shoulder can continue. For a conservative entry, a trader can wait until the first candle closes under the signal line. At the same time, after the completion of the pattern, the price can jump, that is why if a trader waits for the conservative signal, he/she can miss part of the profit.
Protective orders
It is recommended to place a stop loss stop order on the upper point of the right shoulder and gradually transfer it to the break-even zone. For determining a take-profit point a trader shall count the number of points from the top to the bottom of the head, from the highs to the point from which the right shoulder begins to form.
This number of points is added to the price and this will be the point where we place take-profit order. A trader shall remember that take-profit can be transferred, as well as the stop-loss and the entry points should be determined with the help of other strategies or patterns.
Fibo limit trading: magic numbers

Sequence of Fibonacci numbers is one of the most controversial tools in trading, which divided market participants into two opposing camps. Some investors completely trust Fibonacci magic numbers and always rely on them, while others are far apart from this opinion.
However, practice shows that the market participants use this indicator often enough and many strategies have been developed on the basis of this indicator. In this article, we will review one of such strategies, which is called Fibo limit trading.
The strategy is fairly simple, as it does not require any additional indicators or complex market analysis. A trader placed pending orders on trend and his/her main task is to define the completion of the corrective price movement and return of the price into trend.
Setout of indicators and levels
Fibonacci grid is included in the standard list of indicators on trading platforms. This indicator cannot be called a real indicator in full sense, as it does not give signals to open a trade; it just shows the key levels of support and resistance.
Some beginners find it difficult to stretch the grid. We know that it is built from the low of the price to a high or vice versa; but sometimes a trader has several options of stretching a grid.
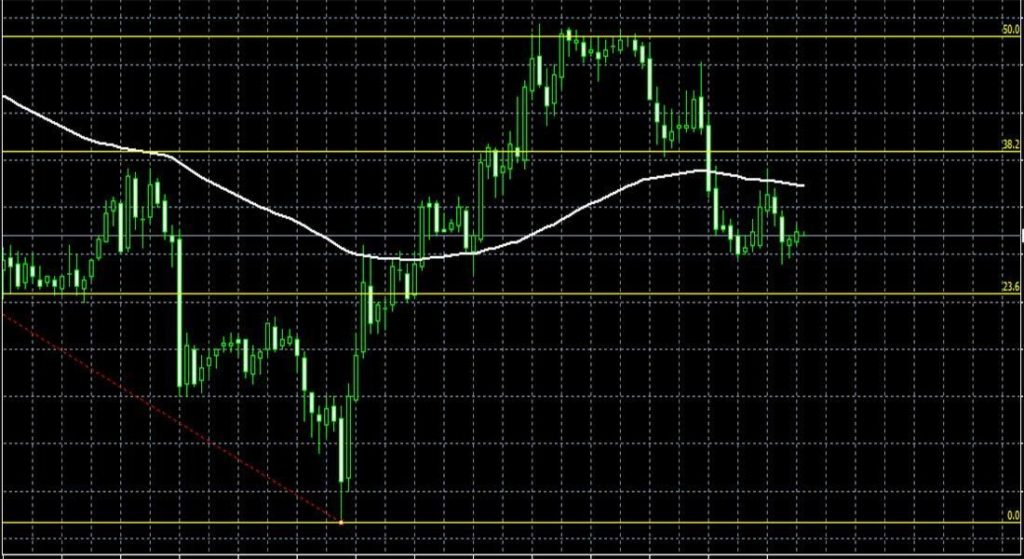
Developers of Fibo limit trading strategy recommend traders to start with the determining of the global trend direction. They can use simple moving average with a period 85 for this. If this line is downwards and the price is above it, we deal with the downtrend and vice versa.
When the global trend is determined, we can start to stretch Fibonacci grid. In case of the downtrend, the grid shall be stretched from the last high of the price to the last low.
Principle of strategy
In Fibo limit trading strategy it is important to define the end of the corrective movement. Key levels in this strategy are 38.2 and 61.8 and pending orders will be placed on them.
If the downtrend goes below the level 38, a trader can place a pending sell order on this level. The same type of order is placed at the level of 61. One or both of these orders can be activated; stop loss for both trades is placed at the next level, which has the value of 80.
Default settings of Fibonacci grid may not have this level, so a trader has to install it. According to the theory of Fibonacci sequence numbers, the value of this level numbers is 78.6, so we need to specify this value in the settings.
It is considered that defining points for placing protective orders is the main difficult task in this strategy. If we use timeframes of one hour or higher, stop-loss level may be large distance away from the price and according to the money-management rules, take-profit orders will be placed twice as far.
A trader may not place take-profit orders at all and close trades manually, or use an option of trailing stop, which will transfer protective level in accordance with the price movement.
Brilliant: a pattern having a real price

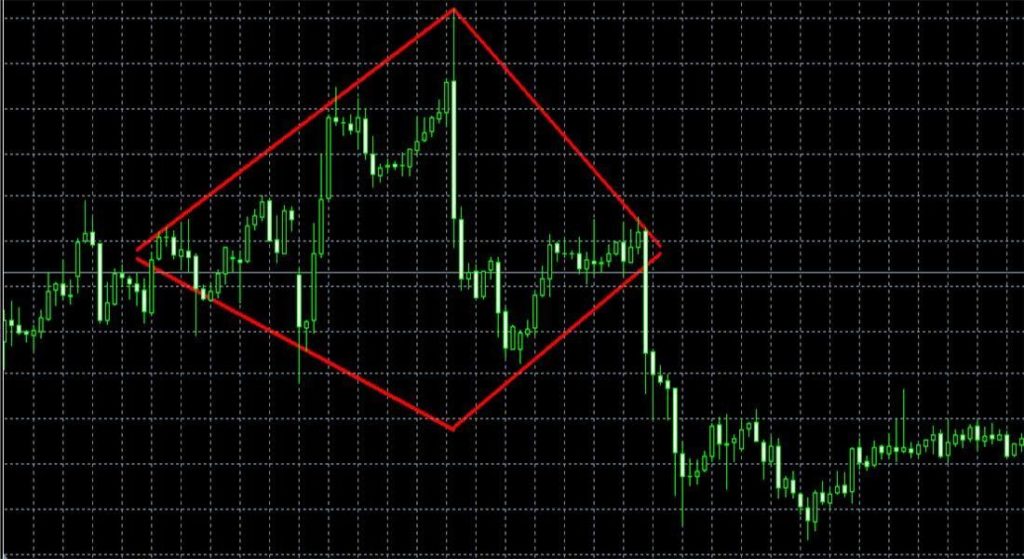
In Forex trading strategies we use many patterns formed by price movement for making forecasts. In fact, each pattern is a part of the trading strategy. One of the patterns is the diamond. This pattern is constructed from two triangles, which when they are connected, look like a cut diamond. Its appearance on the chart indicates possibility of slowdown of the price movement, which means that after strong volatility, both bears and bulls have lost strength and it is not clear now where the price will move.
Formation of the diamond pattern takes place when the strength of both bears and bulls are almost equal and breakdown of the boundaries of the pattern may mean that one of the sides has taken the lead.
Note, that a diamond pattern is quite rare and requires coincidence of several circumstances.
Building up of a pattern
For building up a diamond pattern on the chart we need to study the rules of plotting a triangle. We want to have two triangles, which mean that we will need 6 points.
First triangle has an expanding shape and the second triangle is built as a mirrored copy of the first one. Two points in the middle, representing the tops, as well as the bottoms of the triangles, will coincide. As a result we have a rhombus of the irregular shape or a diamond.
Market entry
As we said before, the formation of a diamond on the chart indicates slowdown of the price movement, so the price can break down the boundaries of the pattern in any direction.
Therefore, breaking down one of the boundaries or consolidation of the price outside the pattern is the he moment of entering the market. The moment of breaking down of a diamond can be regarded as an aggressive signal; traders who prefer conservative trade shall wait when one or several candles will close outside the borders of the pattern.
The chart shows that after the breaking down the pattern, the price begins to in the chosen direction and even has made a significant leap, which means that in case of the conservative transaction, part of the profit would have been missed.
Protective orders
Last high of the price can be used as a point for placing stop-loss order. It is important not to confuse this level with the top of the pattern, since in this case, protective level will be too far from the price level, which contradicts risk management rules.
Here we offer three tips for placing take profit order:
- According to the risk management rules, a trader shall count the number of points to the stop-loss, multiply this value by two or three and add it to the opening price.
- Set the order at the level of the last high or low. In the example on the chart the level of the take-profit will be the bottom of the pattern, that is, the lowest point.
- Calculate the number of points making up the widest part of the diamond and transfer this value from the high or low.
A trader can decide not to place a take profit order at all, especially if the trading platform includes an option of trailing stop, which transfers stop-loss level following the movement of the price.